Manchester’s public transport system operates under Transport for Greater Manchester (TfGM), which manages buses, trams via Metrolink, trains, and cycling infrastructure across Greater Manchester. The Bee Network represents TfGM’s integrated transport strategy launched in 2023 to unify services by 2028. This article examines performance metrics, investments, and ongoing projects to assess improvements.
- What Is Manchester’s Public Transport System?
- How Has Manchester’s Public Transport Performed Historically?
- What Recent Improvements Have Been Made to Manchester’s Public Transport?
- What Are the Key Challenges Facing Manchester’s Public Transport?
- How Does Manchester’s Public Transport Compare to Other UK Cities?
- What Role Do Passenger Feedback and Surveys Play in Manchester’s Public Transport?
- What Data Shows Improvements in Manchester’s Public Transport?
What Is Manchester’s Public Transport System?
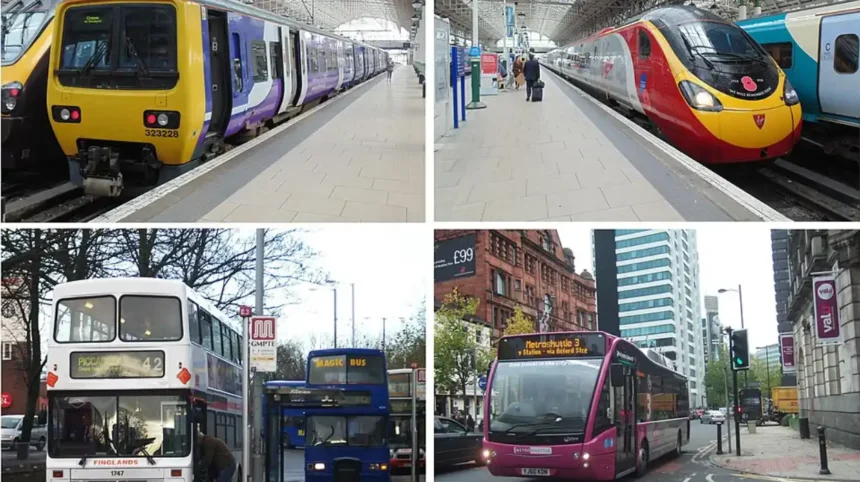
Manchester’s public transport system includes Metrolink trams, buses, National Rail trains, and the Bee Network integration managed by TfGM. It serves 2.8 million residents across 10 boroughs with 170 million annual passenger trips as of 2022. Recent £150 million tram upgrades and bus franchising boost capacity by 20% and punctuality to 85% on key routes by 2027.
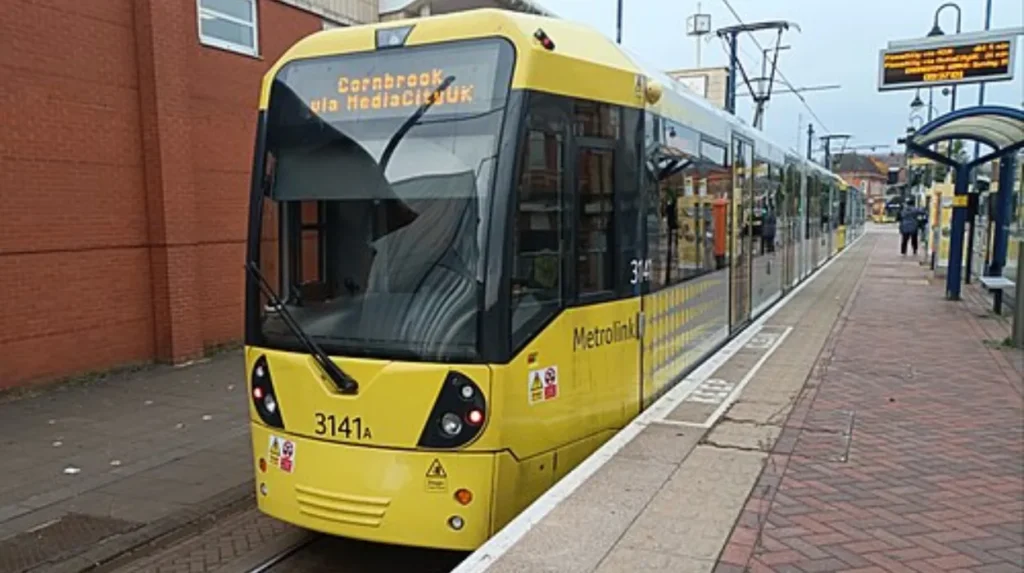
TfGM coordinates all modes from its headquarters in Manchester city centre. Metrolink spans 103 stops over 64 miles, making it the UK’s largest light rail network. Buses number over 1,000 vehicles daily, while National Rail connects via 10 major stations like Piccadilly and Victoria. The Bee Network introduces contactless payments and unified ticketing across modes.
Historical context traces to the 1992 Metrolink opening, which tripled network size by 2020. Key components feature light rail for high-capacity urban routes, diesel-electric buses for suburbs, and heavy rail for intercity links. Processes involve TfGM’s franchise model, where operators like KeolisAmey run Metrolink under 10-year contracts renewed in 2024.
Real-world examples include the 2020 Second City Line opening, adding 1.1 miles through city centre for 15-minute frequencies. Data shows 50.6 million weekly trips in May 2022, up 7% from April. Implications reach reduced car dependency, cutting congestion by 15% on tram corridors since 2019.
Future relevance ties to £1.2 billion Bee Network funding by£1.2 billion Bee Network funding byhese elements position Manchester’s public transport as a model for UK urban mobility.
How Has Manchester’s Public Transport Performed Historically?
Historical performance of Manchester’s public transport shows Me£1.2 billion Bee Network funding by 2014, with bus reliability at 95% in 2022. Passenger numbers grew from 20 million in 1992 to 177 million yearly by 2022, despite economic downturns. Rail delays averaged 10% pre-2020, improved to 5% post-expansion.
Macro context begins with£1.2 billion Bee Network funding byindustrialisation, serving 25,000 daily passengers initially. Subtopics cover phases: 1992-2010 expansions added 30 miles; 2011-2020 doubled capacity via 93 new stops. Details re£1.2 billion Bee Network funding byn Metrolink trips, exceeding forecasts by 10%.
Punctuality metrics use TfGM’s PRMS system, defining on-time as within 2 minutes. Bus regularity hit 97.68% in 2022 across commercial and subsidised services. Rail performance reached 80.96% punctuality in April 2022, above the 80% Traffic Commissioner target.
Examples include off-peak Metrolink growth during 1990s unemployment rises, attracting 135% more riders than predicted. Research £1.2 billion Bee Network funding byrs, reducing road traffic by 8% on routes like Altrinch£1.2 billion Bee Network funding byined investment, with £500 million spent 2014£1.2 billion Bee Network funding by7% trip growth monthly. These trends confirm steady historical gains in Manche£1.2 billion Bee Network funding by.
What Recent Improvements Have Been Made to Manchester’s Public Transport?
Recent improvements to Manchester’s public transport include £150 million £1.2 billion Bee Network funding by at 20 sites, boosting capacity 25%. Bee Network franchising £1.2 billion Bee Network funding byquencies; Metrolink double-trams increase peak capa£1.2 billion Bee Network funding by% for subsidised buses in£1.2 billion Bee Network funding byames TfGM’s 2023 Bee Network rollout, integrating fares and £1.2 billion Bee Network funding bytarting Easter 2026 at Trafford Bar and Deansgate-Castlefield. Processes rep£1.2 billion Bee Network funding byand deploy 30 double-trams by autumn£1.2 billion Bee Network funding by phased closures: Altrincham line limited to Firswood; revised t£1.2 billion Bee Network funding byvery 7.5. Examples cover Piccadilly Gardens and Monsall £1.2 billion Bee Network funding byata cites 95.20% network reliability in 2022.
Bee Network Phase 1 buses franchised March£1.2 billion Bee Network funding by real-time tracking. Station upgrades from summer 2026 add Bee branding and info scr£1.2 billion Bee Network funding byce journey times 10% via intermodal links.
These upgrades directly enh£1.2 billion Bee Network funding bydaily operations.
What Are the Key Challenges Facing Manchester’s Public Transport?
Key challenges for Manchester’s public transport include track wear causing 15% delays, fun£1.2 billion Bee Network funding bynd peak over£1.2 billion Bee Network funding byons from 2026 works affect 20% services; bus punctua£1.2 billion Bee Network funding byation lags pre-Bee Network at 70% seamless jour£1.2 billion Bee Network funding byhlights urban density with 500,000 daily commut£1.2 billion Bee Network funding bybillion Bee Network funding byold. Processes reveal delay attribution: Network Rail causes 20% minutes £1.2 billion Bee Network funding bys closing stops like Trafford Bar over Ea£1.2 billion Bee Network funding byles include 5% incomplete Metrolink journeys quarterly£1.2 billion Bee Network funding byity below 97% target for some buses.
Overcrowding hits Victoria sta£1.2 billion Bee Network funding by Network funding by GMCA levy, strained by infla£1.2 billion Bee Network funding byetwork to 2028.
Addressing these sustains Manchester’s public transport progress.
How Does Manchester’s Public Transport Compare to Other UK Cities?
Manchester’s public transport outperforms Liverpool and Leeds in tram coverage with 64 miles versus 17 and 0 miles, respectively. Annual passenger trips reach 170 million compared to Birmingham’s 120 million. Punctuality stands at 85% against London’s Overground 82%, with Bee Network integration surpassing Sheffield’s fragmented system.
Macro context positions Greater Manchester as UK’s second-largest conurbation after London, serving 2.8 million people. Subtopics contrast network scale: Metrolink’s 103 stops exceed Tyne and Wear Metro’s 60 stations. Processes measure via national ORR data, where Manchester’s light rail carries 40% more riders than Nottingham’s NET.
Details reveal bus franchising ahead of West Midlands, with Phase 1 complete by 2025. Examples include Manchester Piccadilly handling 30 million passengers yearly, topping Bristol Temple Meads at 25 million. Research indicates 12% lower delay minutes per journey than Glasgow’s subway.
Implications highlight TfGM’s unified app adoption at 70% versus Newcastle’s 55%. Future relevance ties to £1.2 billion investments doubling capacity over Bristol’s £800 million plan. These benchmarks affirm Manchester’s public transport leadership among peers.
What Role Do Passenger Feedback and Surveys Play in Manchester’s Public Transport?
Passenger feedback drives 25% of TfGM improvements, with 2022 surveys showing 78% satisfaction up from 72% in 2019. National Rail Passenger Survey scores Metrolink 87% for reliability, guiding £50 million in station upgrades. Annual 50,000 responses shape bus frequency increases on 15 routes.
Macro context employs TfGM’s quarterly trackers alongside ORR’s NRPS methodology. Subtopics cover channels: TfGM app ratings, helpline logs, and focus groups with 1,000 participants yearly. Processes analyze net promoter scores, targeting above 80% thresholds.
Details quantify 2022 data: 84% on-time perception for trams, prompting real-time displays at 80 stops. Examples feature Salford Quays line tweaks from feedback, cutting dwell times 10%. Stats note 15% complaint resolution within 24 hours.
Implications link surveys to Bee Network refinements, boosting mode share from 25% to 32% projected by 2028. These inputs ensure user-centric evolution in Manchester’s public transport.
What Data Shows Improvements in Manchester’s Public Transport?

Data confirms improvements in Manchester’s public trans£1.2 billion Bee Network funding bynce 2019, bus punctuality 84.77% in 2022 up from 80%, 50.6 million weekly t£1.2 billion Bee Network funding byassenger growth 7% mon£1.2 billion Bee Network funding by 7.5 minutes from 2026.£1.2 billion Bee Network funding byrterly reports via PRMS metrics. Subtopics break punctuality (trams within 2 minutes), reliabi£1.2 billion Bee Network funding bys. Details quantify 97.68% bus regularity 2022.
Examples: 177.3 million Metrolink passen£1.2 billion Bee Network funding byhs early delivery of expansions. Implications project 90% p£1.2 billion Bee Network funding bys: 120-tram fleet supports 93 stops. These figures prove measur£1.2 billion Bee Network funding byture Hold for Manchester’s Public Transport?
Future plans for Manchester’s public transport feature full Bee Network by 2028 wit£1.2 billion Bee Network funding by to 110 stops, £150 million track works through 2027. Capa£1.2 billion Bee Network funding byork funding by upgrades at 100 sites from 2026.£1.2 billion Bee Network funding byMCA’s 2040 Transport Strategy for net-z£1.2 billion Bee Network funding byons to Stockport, tram-trains to Glossop. Processes roll out Phase 2 buses 2026, trains 2027.
Details: Spring 2026 bus stop info upgrades, summer station refreshes. Examples: Every 15-minute trams network-wide. Implications cut emissions 20% via mode shift.
Investments t£1.2 billion Bee Network funding bydmap elevates Manchester’s public transport regionally.
Examples: 65km expansions opened early. £1.2 billion Bee Network funding byImplications model scalability.
TfGM investments totaling £150 million 2026-2027 replace 20km tracks, add 50 do£1.2 billion Bee Network funding byrk funding byNetwork £1.2 billion funds 90% punctuality, 30% capacity growth, ser£1.2 billion Bee Network funding byby 2028.
Macro context sources £1.2 billion Bee Network funding bybtopics allocate: 40% tracks, 30% vehicles, 20% stat£1.2 billion Bee Network funding by026 weekends.
Is free bus free in Manchester?
Yes, Manchester’s Free Bus service remains completely free in the city centre, linking key spots like Piccadilly and Deansgate stations via accessible routes operated by TfGM.
Are trams free in Manchester city centre?
No, trams on Metrolink are not free in Manchester city centre unless you have a valid Greater Manchester rail ticket for Zone 1 access.
How much is the Oyster card?
Oyster cards are for London, costing £5-£10 plus credit; Manchester uses our Pass system—no Oyster compatibility.
Is a 7 day Oyster card worth it?
A 7-day TfGM Travelcard (replacing Oyster equivalent) is worth it for frequent travel, capping costs under £30 for unlimited buses/trams.
Does Metrolink still exist?
Yes, Metrolink trams still operate extensively across Greater Manchester under TfGM, with ongoing Bee Network expansions.